Fornax's Guide To Ridiculously Fast Ethernet
- Introduction
- Sysctls
- Network Interface Cards
- ethtool
- BIOS
- Reverse proxy
- HTTP/2 or QUIC?
- Operating system
- Kernel
- That’s all, folks!
Introduction
If you are one of the lucky few who has a fast enough connection, you might have just downloaded a 5 GB file in 10 seconds and wondered how that is even possible. Well, it took a lot of effort to get there.
When I first ordered a 100 GbE server I expected things to just work. Imagine my surprise when the server crashed when serving at just 20 Gigabit.
Then I expected my server host to be able to help with the performance problems. Spoiler alert: They could not help me.
That’s where my journey into the rabbit hole of network performance started. I paid good money for that 100 Gigabit connection and I’ll be damned if I can’t use all of it. I’m getting to the bottom of this no matter how long it takes…
It took me well over a year to figure out all the details of high speed networking. My good friend Jeff Brandt (who has been hosting pixeldrain for nearly ten years now) was able to point me in the right direction by explaining the basics and showing me some sysctls and ethtool commands which might affect performance. That was just the entrance of the rabbit hole though, and this one carried on deep. After about a year of trial and error pixeldrain can finally serve files at 100 Gigabit per second.
Below is a summary of everything I discovered during my year of reading NIC manuals, digging through the kernel sources, running profilers, patching the kernel, learning about CPU topology and TCP inner workings.
Sysctls
When looking into network performance problems the sysctls are usually the
first thing you get pointed at. There is a ton of conflicting information
online about which sysctls do what and what to set them to.
Sysctls are not persistent through reboots, add these lines to
/etc/sysctl.conf to apply them at startup.
Through experimentation and kernel recompilation I finally settled on these values:
net.ipv4.tcp_congestion_control
You might have heard of BBR. Google’s new revolutionary congestion control algorithm. You might have heard conflicting information about how good it is. I have extensively tested all congestion controls in the kernel and I can say without a doubt that BBR is the best, by far! BBR is the only algo which does not absolutely tank your transfer rate when a packet is lost.
TCP BBR was merged into the kernel at version 4.9. I know the sysctl says ipv4, but it works for IPv6 as well.
net.ipv4.tcp_congestion_control=bbr
net.core.default_qdisc and txqueuelen
The qdisc (queuing discipline) is another param which gets mentioned often. The qdisc orders packets which are queued so they can be sent in the most efficient order possible. The thing is, when you’re sending at 100 Gbps then queuing is completely irrelevant, the network is rarely the bottleneck here.
Google used to require fq with bbr, but that requirement has been dropped. I
suggest you use something minimal and fast. How about pfifo_fast, it has fast
in the name, must be good, right? This is actually already the default on Linux
nowadays, so there’s not really a need to change it.
net.core.default_qdisc=pfifo_fast
A queue must have a size though. Linux gives the network queues a size of 1000 packets by default. As we’ll learn later, a thousand packets is really not a lot when running at 100 Gbps. When the queue is full the kernel will actually drop packets, which is absolutely not what we want. So we increase the queue length to 10000 packets instead:
ip link set $INTERFACE txqueuelen 10000
net.ipv4.tcp_shrink_window
This sysctl was developed by Cloudflare. The patch was merged into Linux 6.1. If you are on an older kernel version than 6.1 you will need to manually apply the patches and compile the kernel on your machine. Without this patch the kernel will waste so much time and memory on buffer management that by the time you reach 100 Gigabit the kernel won’t even have time to run your app anymore.
Cloudflare has an extensive writeup about the problem this sysctl solves here: Unbounded memory usage by TCP for receive buffers, and how we fixed it
This sysctl makes sure that TCP buffers are shrunk if they are larger than they need to be. Without this sysctl your buffers will just continue to grow until memory runs out! Before I discovered this patch my servers would regularly run out of memory during peak load, and these are servers with a TeraByte of RAM! After applying the patches (and compiling the kernel, because the patches were not merged yet back then) memory usage from TCP buffers was reduced by 80% on my systems. And performance has improved considerably. This patch is so crucial for performance that it boggles my mind that it’s not enabled by default. It’s even described in the TCP spec, it’s standardized behaviour. If you’re a kernel or systemd developer, please consider just turning this on by default instead of hiding it behind a toggle.
net.ipv4.tcp_shrink_window=1
Cloudflare has some other sysctls as well, but those focus more on latency than
throughput. You can find them here: Optimizing TCP for high WAN throughput
while preserving low
latency.
The net.ipv4.tcp_collapse_max_bytes sysctl they write about here was never
merged into the kernel. But while it does improve latency a bit, it’s not that
important for throughput.
net.ipv4.tcp_{w,r}mem
These variables dictate how much memory can be allocated for your send and receive buffers. The send and receive buffers are where TCP packets are stored which are not yet acknowledged by the peer. The required size of these buffers depends on your Bandwidth-Delay Product (BDP). This concept is crucial to understand. If you set the TCP buffers too small it will literally put a speed limit on your connection.
First let’s go over how TCP sends data. TCP can retransmit packets if the client did not receive them. To do this TCP needs to keep all the data it sends to the client in memory until the client acknowledges (ACK) that it has been properly received. The acknowledgment takes one round trip to the client and back.
Let’s say you want to send a file from Amsterdam to Tokyo. The server sends the first packet, 130ms later the client in Tokyo receives the data packet. The client then sends ACK to tell the server that the packet was properly received, the ACK takes 130ms to arrive back in Amsterdam. Only now can the server remove the packet from memory. The whole exchange took 260ms.
Now let’s say we want to send files at 10 Gigabit. 10 Gigabit is 1250 MB. We
multiply the number of bytes we want to send per second by the number of seconds
it takes to get back the ACK. That’s 1250 MB * 0.260 s = 325 MB. Now we know
that our buffer needs to be at least 325 MB to reach a speed of 10 Gigabit over
a 260ms round trip.
The kernel also stores some other TCP-related stuff in that memory, and we also need to account for packet loss which causes packets to be stored for a longer time. I also don’t want the speed to be limited to 10 Gbps, we’re running a 100 GbE NIC after all. For this reason pixeldrain servers use a maximum buffer size of 1 GiB.
net.ipv4.tcp_wmem='4096 65536 1073741824'
net.core.wmem_max=1073741824
net.ipv4.tcp_rmem='4096 65536 1073741824'
net.core.rmem_max=1073741824
The three values in the wmem and rmem are the minimum buffer size, the default buffer size and the maximum buffer size. The pixeldrain server application uses 64k reusable buffers (with sync.Pool) all over the codebase. For this reason we initialize the window size at 64k as well.
net.ipv4.tcp_mem
We just configured the buffer sizes, what’s this for then? Well… we can tune TCP buffers per connection all we want, but all that is for nothing if the kernel still limits the TCP buffers globally.
This sysctl configures how much system memory can be used for TCP buffers. On boot these values are set based on available system memory, which is good. But by default it only uses like 5% of the memory, which is not even close to enough. We need to pump those numbers way up to get anywhere near the speed that we want.
tcp_mem is defined as three separate values. These values are in numbers of memory pages. A memory page is usually 4096B. Here is what these three values mean:
low: When TCP memory is below this threshold then TCP buffer sizes are not limited.pressure: When the TCP memory usage exceeds this threshold it will try to shrink some TCP buffers to free up memory. It will keep doing this until memory usage drops belowlowagain. Shrinking TCP buffers takes a lot of CPU time, and during this time no data is sent to the client. You don’t want to setlowandpressuretoo far apart.high: The TCP system can’t allocate more than this number of pages. If this limit is reached and a new TCP session is opened it will not be able to allocate any memory. Needless to say this is terrible for performance.
After a lot of experimentation with these values I have come to the conclusion that the best values for these parameters are 40% of RAM, 50% of RAM and 60% of RAM. This will use most of the RAM for TCP buffers if needed, but also leaves plenty for your applications.
I set these values dynamically per host with Ansible:
- name: configure tcp_mem
  sysctl:
    name: net.ipv4.tcp_mem
    value: "{{ (mempages|int * 0.4)|int }} {{ (mempages|int * 0.5)|int }} {{ (mempages|int * 0.6)|int }}"
    state: present
  vars:
    mempages: "{{ ansible_memtotal_mb * 256 }}" # There are 256 mempages in a MiB
Network Interface Cards
There are lots of NICs to choose from. From my testing every NIC seems to behave differently. The only NIC types I have had any luck with are ConnectX-5 and ConnectX-6. Intel’s E810 NICs are also not terrible, but Nvidia cards seem to fare much better with high connection counts. I currently have two servers with E810 cards and two servers with ConnectX-6 cards. The E810 cards are usually the first to crap out during a load peak. NICs are just fickle beasts overall. I don’t know if my experiences are actually related to the quality of the cards, or just bad luck with faulty hardware.
Often you see advice to install a proprietary driver for your NIC. Don’t do that. In my experience that has only caused problems. Nvidia’s NIC drivers are just as shitty as their video drivers. They will break kernel updates and generally make your life miserable. The drivers in the Linux kernel are good and well maintained. You don’t need to taint your kernel with some scary proprietary blob.
Upgrading the firmware for your NIC can be a good idea, if you can figure out how, that is. Nvidia’s tools for upgrading firmware are a huge hassle to work with and the documentation is outdated and scarce.
ethtool
Ethtool is a program which you can use to configure your network card. There is lots of stuff to configure here, but there are only three settings which really matter.
Ethtool needs your network interface name for every operation. In this guide we
will refer to your interface name as $INTERFACE. You can get your interface
name from ip a.
Ethtool options are not persistent through reboots. And there’s no configuration file to put them in either. So you’ll need to put them in a script which runs somewhere in the boot process somehow.
Channels (ethtool -l)
The channels param configures how many CPU cores will communicate with the NIC. You generally want this number to be equal to the number of CPU cores you have, that way the load will be evenly spread across your CPU. If you have more CPU cores than your NIC supports you can try turning multithreading off in the BIOS. Or just accept that only a portion of your cores will communicate with the NIC, it’s not that big of a problem.
If you are running on a multi-CPU platform you only want one CPU to communicate with the NIC. Distributing your channels over multiple CPUs will cause cache thrashing which absolutely tanks performance. Many of pixeldrain’s server are dual CPU, where one CPU runs the pixeldrain software and the other only communicates with the NIC. Buying a $10k CPU just to talk to a NIC is a bit wasteful, I recommend just using one CPU if you have the choice.
Your NIC will usually configure the channels correctly on boot, so in most of
the cases you don’t need to change anything here. You can query the settings
with ethtool -l $INTERFACE and update the values like this: ethtool -L
$INTERFACE combined 63.
Ring buffers (ethtool -g)
The ring buffers are portions of RAM where the NIC stores your IP packets before they are sent out to the network (tx) or sent to the CPU (rx). Increasing the ring buffer sizes can increase network latency a little bit because more packets are getting buffered before being sent out to the network. But again, at 100 GbE this happens so fast that the difference is in the order of microseconds, that makes absolutely no difference to us. We just want to move as much data as possible in as little time as possible.
If we can buffer more packets then it means we can transfer more data in bulk
with every clock cycle. So we simply set this to the maximum. For Mellanox cards
the maximum is usually 8192, but this can vary. Check the maximum values for
your card with ethtool -g $INTERFACE.
Set the receive and send buffers to 8192 packets: ethtool -G $INTERFACE rx 8192
tx 8192
Interrupt Coalescing (ethtool -c)
The NIC can’t just write your packets to the CPU and expect it to do something with them. Your CPU needs to be made aware that there is new data to process. That happens with an interrupt. Ethtool’s interrupt coalescing values tell the NIC when and how to send interrupts to the CPU. This is a delicate balance. We don’t want to interrupt the CPU too often, because then it won’t be able to get any work done. That’s like getting a new ping in team chat every half hour, how are you supposed to concentrate like that? But if we set the interrupt rate too slow, the NIC won’t be able to send all packets in time before the buffers fill up.
The interrupt coalescing options vary a lot per NIC type.. These are the ones
which are present on my ConnectX-6 Dx: rx-usecs, rx-frames, tx-usecs,
tx-frames, cqe-mode-rx, cqe-mode-tx. I’ll explain what these are:
rx-usecs,tx-usecs: These values dictate how often the NIC interrupts the CPU to receive packetsrxor send packetstx. The value is in microseconds. The SI prefix for micro is µ, but for convenience they use the letter u here. A microsecond is one-millionth of a second.rx-frames,tx-frames: Like the values above this defines how often the CPU is interrupted, but instead of interrupting the CPU at a fixed interval it interrupts the CPU when a certain number of packets are in the buffer.cqe-mode-rx,cqe-mode-tx: These options enable packet compression in the PCI bus. This is handy if your PCI bus is a bottleneck, like when your 100G NIC is plugged into 4x PCI 4.0 lanes, which only has 7.88 GB/s bandwidth. In most cases it’s best to leave these at the default value.adaptive-rx,adaptive-tx: These values tell the NIC to calculate its own interrupt timings. This disregards the values we configure ourselves. The timings calculated by the NIC often prefer low latency over throughput and can quickly overwhelm the CPU with interrupts. So for our purposes this needs to be disabled.
So what are good values for these? Well, we can do some math here. Our NIC can send 100 Gigabits per second. That’s 12.5 GB. A network packet is usually 1500 bytes. This means that we need to send 8333333 packets per second to reach full speed. Our ring buffer can hold 8192 packets, so if we divide by that number we learn that we need to send 1017 entire ring buffers per second to reach full speed.
Waiting for the ring buffer to be completely full is probably not a good idea,
since then we can’t add more packets until the previous packets have been copied
out. So we want to be able to empty the ring buffer twice. That leaves us with
2034 ring buffers per second. Now convert that buffers per second number to µs
per buffer: 1000000 / 2034 = 492µs, we land on a value of 492µs per interrupt.
This is our ceiling value. Higher than this and the buffers will overflow. But
492µs is nearly half a millisecond, that’s an eternity in CPU time. That’s high
enough that it might actually make a measurable difference in packet latency. So
we opt for a more sane value of 100µs instead. That still gives the CPU plenty
of time to do other work in between interrupts. A 3 GHz CPU core will be able to
perform about 30000 calculations inbetween each interrupt. At the same time it’s
low enough to barely make a measurable difference in latency, at most a tenth of
a millisecond.
As for the {rx,tx}-frames variables. We just spent all that time calculating
the ideal interrupt interval, I don’t really want the NIC to start interrupting
my CPU when it’s not absolutely necessary. So we use the maximum ring buffer
value here: 8192. Your NIC might not support such high coalescing values. You
can also try setting this to 4096 or 2048 if you notice problems.
That leaves us with this configuration:
ethtool -C $INTERFACE adaptive-rx off adaptive-tx off \
		rx-usecs 100 tx-usecs 100 \
		rx-frames 8192 tx-frames 8192
Tip: If you want to see how much time your CPU is spending on handling
interrupts, go into htop, then to Setup (F2) and enable “Detailed CPU time”
under Display options. The CPU gauge will now show time spent on handling
interrupts in purple. Press F10 to save changes.
BIOS
Not even the BIOS is safe from our optimization journey. If fact, some of the most important optimizations must be configured here.
NUMA Nodes per socket
Big CPUs with lots of cores often segment their memory into NUMA nodes. These
smaller nodes get exclusive access to a certain portion of RAM and don’t have to
contend over memory access with the other NUMA nodes. This can improve your
performance… if your software supports it well. But from my testing the setup
of one NIC queue per core does not combine well with having multiple NUMA nodes.
The fact that I use Go, which does not have a NUMA aware scheduler as far as I
know, probably does not help either. For these reasons I prefer to set NUMA
nodes per socket to NPS1.
Some AMD BIOSes also have an option called ACPI SRAT L3 Cache as NUMA Domain.
This will create NUMA nodes based on the L3 cache topology, even if you
explicitly disabled NUMA in the memory addressing settings. To fix this set
ACPI SRAT L3 Cache as NUMA Domain to Disabled.
SMT Control
Multithreading (or Hyperthreading, on Intel) can be a performance booster, but it can also be a performance bottleneck. If you have a CPU with a lot of cores, like AMD’s Epyc lineup, then disabling SMT can be a good way to improve per-core performance.
Most apps have no way to effectively use hundreds of CPU threads. At some point
adding more threads will only consume more memory and CPU cycles just because
the kernel scheduler, memory controller and your language runtime have to manage
all those threads. This can cause huge amounts of overhead. My rule of thumb: If
you have 64 or more cores: SMT OFF
IOMMU
The Input-output memory management unit is a CPU component for virtualizing your memory access. This can be useful if you run a lot of VMs for example. You know what it’s also good for? Completely destroying NIC performance.
A high end NIC needs to shuffle a lot of data over the PCI bus. A 100 GbE NIC in full duplex can reach up to 25 GB/s! When the IOMMU is enabled it means that all the data that the NIC sends/receives needs to go through the IOMMU first before it can go into RAM. This adds a little bit of latency. When you are running a high end NIC in your PCI slot, then the added latency makes sure that your NIC will never ever get anywhwere near the advertised speed. In some cases the overhead is so large that the NIC will effectively drop off the PCI bus, immediately crashing your system once it gets only slightly overloaded. Yes, really, I have seen this happen.
Seriously, if you have a high end NIC plugged into your PCI slot and you have the IOMMU enabled. You might as well plug a goddamn brick into your PCI slot, because that’s about as useful as your expensive NIC will be.
It took me way too long to find this information. The difference between IOMMU off and on is night and day. I am actually furious that it took me so long to discover this. I spent weeks pulling hair out of my head trying to figure out why my NIC was locking up whenever I tried to put any real load on it. All the NIC tuning guides I could find talk about tweaking little ethtool params, installing drivers, updating firmware and useles crap like that, the IOMMU was completely omitted in every one of them. I was getting so desperate with my terrible NIC performance that I just started flipping toggles in the BIOS to see if anything made a difference. If you have any idea how long it takes to reboot a high end server system you know how tedious this is. That’s how I discovered that the IOMMU was the source of all my problems.
Ugh, just thinking about all the time I wasted because because nobody told me to just turn the IOMMU off gets my blood boiling. That’s why I am writing this guide, I want to spare you the suffering.
So yea… AMD CBS > NBIO Common Options > IOMMU > Disabled …AND STAY DOWN!
I also just turn off anything related to virtualization nowadays. Having virtualization options enabled when you are not running VMs is a waste of resources. No worries, docker is not virtualization, it’s just namespacing, nothing virtual about that. And if you are running VMs.. well, consider bare metal. It’s really not that scary and there is lots of performance to be gained.
You can verify that your IOMMU is disabled with this command dmesg | grep
iommu. Your IOMMU is disabled if it prints something along the lines of:
[    1.302786] iommu: Default domain type: Translated
[    1.302786] iommu: DMA domain TLB invalidation policy: lazy mode
If you see more output than that, you need to drop into the BIOS and nuke that shit immediately.
One little caveat is that Linux requires the IOMMU to support more than 255 CPU
threads. So if you have 256 threads and the IOMMU is turned off one of your
threads will be disabled. So once again I will repeat my rule of thumb with
regards to multithreading: If you have 64 or more cores: SMT OFF
Reverse proxy
A lot of sites run behind a reverse proxy like nginx or Caddy. It seems to be an industry standard nowadays. People are surprised when they learn that pixeldrain does not use one of the standard web servers.
As it turns out, 100 Gigabit per second is a lot of data. It takes a considerable amount of CPU time to churn through that much data, so ideally you want to touch it as few times as you can. At this scale playing hot potato with your HTTP requests is a really bad idea.
A big bottleneck with networking on Linux is copying data across the kernel boundary. The kernel always needs to copy your buffers because userspace is dirty, ew, would not want to share memory with that. When you are running a reverse proxy every HTTP request is effectively crossing the kernel boundary six times. Let’s assume we’re running nginx here, the client sends a request to the server. The kernel copies the request body from kernel space to nginx’s listener (from kernel space to userspace), nginx opens a request to your app and copies the body the to localhost TCP socket (back to kernel space). The kernel sends the body to your app’s listener on localhost (now it’s in userspace again). And then the response body follows the same path again. Request: NIC -> kernel -> userspace -> kernel -> userspace. Response: userspace -> kernel -> userspace -> kernel -> NIC. That’s crazy inefficient.
That’s why pixeldrain just uses Go’s built in HTTP server. Go’s HTTP server is very complete. Everything you need is there:
- Routing
- TLS (for HTTPS)
- HTTP/2
- Even a reverse proxy if you’re into that kinda stuff
The only requirement is that your app is written in Go. Of course other languages also have libraries for this.
Zero-downtime restarts are a bit tricky. Luckily the geniuses tinkering away at
the Linux kernel every day made something neat for us. It’s called
SO_REUSEPORT (Wow! Catchy name!). By putting this socket option on your TCP
listener you allow future instances of your server process to listen on the same
port at the same time. By doing this your upgrades become really quite simple:
- Upload new server executable to the server.
- Start the new executable up.
- When everything is initialized it starts listening on the same port as the
previous process using
SO_REUSEPORT. - After the listener is installed we signal to the old server process (which is still running at this point) that it can start shutting down. The listener is closed and the active HTTP requests are gracefully completed.
- Once the old listener is closed all new requests will go to the new process and the upgrade is complete.
Now there may be one question on your mind: How do I signal to the previous
process that the new process has finished initializing? I have just the thing
for you. This handy-dandy library that I
made. I use it for pixeldrain and it
works like a charm. Your software updates are just one SIGHUP away from being
deployed.
HTTP/2 or QUIC?
HTTP/2 and QUIC (HTTP/3) are new revisions of the HyperText Transfer Protocol. HTTP/2 introduces multiplexing which significantly reduces handshake latency. HTTP/1.1 will open a separate TCP session for each file it needs to request, HTTP/2 opens one connection instead and uses framing to send multiple requests at the same time instead, this allows the connection to ramp up to a higher speed and quicker. This goes hand in hand with the BBR congestion control algorithm which also significantly reduces connection ramp-up time. The result is 60% faster loading times for web pages on average.
HTTP/2 is trivially enabled in the Go HTTP server. Simply add NextProtos =
[]string{"h2"} to your tls.Config and it’s good to go. An annoying
implementation detail is that Go’s HTTP/2 server throws completely different
errors than HTTP/1.1, so you will have to redo all your error handling. To make
matters worse, HTTP/2’s errors are not exported by the http package, so you
have to resort to string searching to catch these errors.. 😒.
Then along comes HTTP/3, also known as QUIC. HTTP/3 throws everything we just did out of the window and uses UDP instead. It moves all the buffer management and congestion control to userspace. Sure, you get more control that way, but that’s really only useful if you’re Google. I tried the most popular HTTP/3 server implementation for Go, and it struggled to even reach half of the throughput I got with HTTP/2. Sure, latency is lower, but that’s not that useful to me when the most important part of my site stops functioning. Sure, TCP is not perfect, but it’s better than having to do everything yourself.
To summarize, if you only care about throughput: HTTP/2 👍 HTTP/3 👎 (for now)
Operating system
Choose something up-to-date, lightweight and minimalist. Pixeldrain used to run on Ubuntu because I was familiar with it, but over time Ubuntu server got more bloated and heavy. Unnecessary stuff was being added with each new release (looking at you snapd), and I just didn’t want to deal with that. Eventually I switched to Debian.
Debian is so much better than Ubuntu. After booting it for the first time there will only be like 10 processes running on the system, just the essentials. It really is a clean sandbox waiting for you to build a castle in it. It might take some getting used to, but it will definitely pay off.
Anyway, that’s just my opinion. In reality you can pick any distro you like. It does not really matter that much. Just keep in mind that some distro’s ship newer kernels than others, and that’s really quite important as we will learn in the next paragraph.
Kernel
You need to run at least kernel 6.1, because of the net.ipv4.tcp_shrink_window
sysctl. But generally, newer is better. There are dozens of engineers from
Google, Cloudflare and Meta tinkering away at the Linux network stack every day.
It gets better with every release, really, the pace is staggering.
But doesn’t Debian ship quite old kernel packages? (you might ask) Yes… kinda.
By using this guide you can
upgrade your kernel version to the testing or even the experimental branch
while keeping the rest of the OS the same.
On the Debian package tracker you can
see which kernel version ships in which repository. This is useful for picking
which repo you want to use for your kernel updates. Pixeldrain gets its kernel
updates from the testing branch. These are kernels which have been declared
stable by the kernel developers and are generally safe to use.
Keep an eye on the Phoronix Linux Networking blog for new kernel features. Pretty much every kernel version that comes out boasts about huge network performance wins. I’m personally waiting for Kernel 6.8 to come out. They are promising a 40% TCP performance boost. Crazy!
That’s all, folks!
Behold.. One hundred gigabits per second!
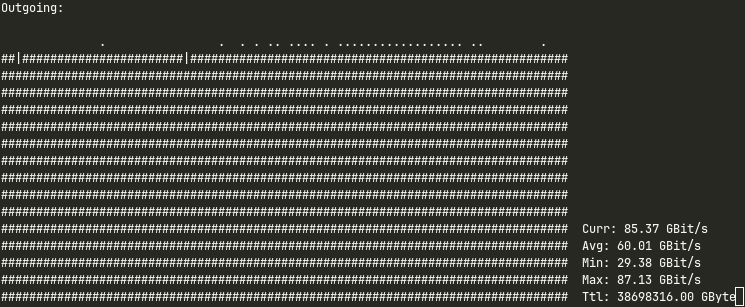
Actually my nload seems to cap out at around 87 Gbps.. there’s probably some overhead somewhere. It’s close though.
I hope this guide was useful to you. I wish I had something like this when I started out. I could have quite literally saved me months of time. Then again, chasing 100 Gigabit is one of the most educative challenges I have ever faced. I have learned so much about Linux’s structure, kernel performance profiling, CPU architecture, the PCIe bus and tons of other things that I would never have known if I did not go down this rabbit hole. And I have a feeling the journey is not over. I will always have this urge to get the absolute most out of my servers. I’m paying for the whole CPU and I’m going to use the whole CPU after all.
Anyway, check out Pixeldrain if you like, it’s the fastest way to transfer files across the web. And I’m working on a cloud storage offering as well. It has built in rclone and FTPS support. Pixeldrain also has a built in speedtest which you can use to see the fruits of my labour. The source for this document is available in markdown format on my GitHub.
Follow me on Mastodon, Twitter, join our Discord, et cetera et cetera